System monitoring
Available from firmware version 2025.0
The system monitoring is a library that consists of the components system watchdog and system monitor. The firmware component system monitor has been released with firmware version 2025.0 and extends the system watchdog with diagnostic options. It monitors system critical parameters like RAM and CPU usage, as well the processes of the PLCnext firmware and emits notifications if certain events are triggered, for example if a threshold is exceeded or a process is aborted unplanned.
The system watchdog subscribes fatal thresholds of the system critical parameters of the system monitor and also adds some warning thresholds for RAM, and CPU load. It further triggers and supervises the shutdown of the firmware and the reset of the controller in case of an emergency reset.
Configuration of the system monitoring
The default configuration of the system watchdog can be found in the configuration file under /etc/plcnext/device/System/Monitoring/Default.wdg.config. The limit values above which a warning is issued or an action is executed are defined here.
To change the configuration or to use your own configuration, place your own configuration file at /opt/plcnext/config/System/Monitoring/ and adjust the values. You can copy the Default.wdg.config file, save it under a new name (ensuring it ends with .wdg.config), and customize the parameters. The files Default.wdg.config and *.wdg.config will then be merged. If you use the same name for an event in your configuration file, such as Full.Load.Warn, the values of the default configuration file will be overwritten by the customized configuration.
Default XML configuration file:
<?xml version="1.0" encoding="UTF-8"?>
<SystemWatchdogConfigDocument schemaVersion="1.0.0.0">
  <SystemWatchdogConfig>
    <MonitorEventSubscriptions>
      <CpuLoadEventSubscriptions>
        <CpuLoadEventSub name="Full.Load.Warn"     cpu="$ARP_EXT_ARBITRARY_CORE_MASK$"  priolevel="0" upperThresh="95" lowerThresh="70" upperDur="10s" lowerDur="60s" reaction="Warning"  diagSetName="disabled" />
        <CpuLoadEventSub name="Disturb.Load.Warn"  cpu="$ARP_EXT_ARBITRARY_CORE_MASK$"  priolevel="1" upperThresh="95" lowerThresh="70" upperDur="2s"  lowerDur="60s" reaction="Warning"  diagSetName="std_cpu" />
        <CpuLoadEventSub name="Disturb.Load.Swd"   cpu="$ARP_EXT_ARBITRARY_CORE_MASK$"  priolevel="1" upperThresh="95" lowerThresh="70" upperDur="15s" lowerDur="60s" reaction="Watchdog" diagSetName="ext_cpu" />
        <CpuLoadEventSub name="Critical.Load.Warn" cpu="$ARP_EXT_ARBITRARY_CORE_MASK$"  priolevel="2" upperThresh="95" lowerThresh="70" upperDur="1s"  lowerDur="60s" reaction="Warning"  diagSetName="std_cpu" />
        <CpuLoadEventSub name="Critical.Load.Swd"  cpu="$ARP_EXT_ARBITRARY_CORE_MASK$"  priolevel="2" upperThresh="95" lowerThresh="70" upperDur="3s"  lowerDur="60s" reaction="Watchdog" diagSetName="ext_cpu" />
      </CpuLoadEventSubscriptions>
      <SystemRamLoadEventSubscriptions>
        <!-- deprecated, use SystemMemLoadEventSubscriptions/SystemMemLoadEventSub<mem ="Ram"> instead -->
        <SystemRamLoadEventSub name="RamLoad.Warn" upperThresh="90" lowerThresh="85" upperDur="1000ms" lowerDur="60s" reaction="Warning"  diagSetName="std_ram"/>
        <SystemRamLoadEventSub name="RamLoad.Swd"  upperThresh="95" lowerThresh="90" upperDur="1000ms" lowerDur="60s" reaction="Watchdog" diagSetName="std_ram"/>
      </SystemRamLoadEventSubscriptions>
      <SystemMemLoadEventSubscriptions>
        <SystemMemLoadEventSub name="OFs.Load.Swd"  mem ="OFs" upperThresh="97" lowerThresh="90" upperDur="1s" lowerDur="60s" reaction="Watchdog" diagSetName="standard"/>
      </SystemMemLoadEventSubscriptions>
    </MonitorEventSubscriptions>
    <DiagnosticSets>
      <DiagnosticSet name="disabled" collectLogs="false" ramLoads="false" cpuLoads="false" lttng="false" />
      <DiagnosticSet name="standard" collectLogs="true"  ramLoads="false" cpuLoads="false" lttng="false" />
      <DiagnosticSet name="std_cpu"  collectLogs="false" ramLoads="false" cpuLoads="true"  lttng="false" />
      <DiagnosticSet name="ext_cpu"  collectLogs="true"  ramLoads="false" cpuLoads="true"  lttng="true" />
      <DiagnosticSet name="std_ram"  collectLogs="true"  ramLoads="true"  cpuLoads="false" lttng="false" />
      <!-- possible settings for Monitoring Step2  FW 2025.0
      <DiagnosticSet name="std_tem"  collectLogs="true"  ramLoads="false" cpuLoads="false" lttng="false" />
      <DiagnosticSet name="std_hum"  collectLogs="true"  ramLoads="false" cpuLoads="false" lttng="false" />
      -->
      <DiagnosticSet name="std_prc"  collectLogs="true"  ramLoads="false" cpuLoads="false" lttng="true"  />
      <!-- this is a internal used DiagnosticSet for process-monitoring -->
    </DiagnosticSets>

    <StartupCheckConfig>
      <!-- reserveFileSizeInPercent must be at least 12%! -->
      <OverlayFsCheckConfig reserveFileSizeInPercent="12" diagSet="standard"/>
    </StartupCheckConfig>

  </SystemWatchdogConfig>
</SystemWatchdogConfigDocument>
Within the <SystemWatchdogConfigDocument> schema, there are the following XML elements to be configured:
<MonitorEventSubscriptions>consisting of<CpuLoadEventSubscriptions>and<SystemRamLoadEventSubscriptions><DiagnosticSets>
<CpuLoadEventSubscriptions>
The CpuLoadEventSubscriptions element defines the monitoring of the CPU load and the corresponding reactions to certain events.
CpuLoadEventSub
| Attribute | Description |
name |
Unique name of the CpuLoadEventSubscriptionIf a new name is created, a new subscription is created with it. |
|
cpu |
The cpu attribute is used to define which CPU is to be analyzed.If you want to analyze a specific core, select the core by adding a number, for example cpu="1" or cpu="2". With cpu="0" the whole system is analyzed. |
priolevel |
The priority with which the CPU load event must be monitored is specified here.priolevel="0" Full load event: 100% CPU usage but all tasks are still being processedpriolevel="1" Disturb load event: low priority tasks cannot find a timeslot for execution. The system does not work as expectedpriolevel="2" Critical load event: the process is not controllable and very critical
|
upperThresh |
This attribute sets the upper threshold for the CPU load (for example upperThresh="95" at 95 %). If the CPU load exceeds this value, the specified reaction (for example a warning) will be triggered after the duration specified in upperDur. |
lowerThresh |
This attribute sets the lower threshold for the CPU load (for example lowerThresh="70" at 70 %). If the CPU load falls below this value, a notification is issued after the duration specified in lowerDur(only for reaction="Warning"). |
upperDur |
The CPU load must exceed the upper threshold (upperThresh) for the time defined in upperDur (for example upperDur="10s" for 10 seconds) before the reaction is triggered. |
lowerDur |
The CPU load must remain below the lower threshold (lowerThresh) for the time defined in lowerDur (for example lowerDur="60s" for 60 seconds). |
reaction |
This attribute specifies the action to be taken when the specified threshold is crossed. With reaction="Warning", a warning is issued. With reaction="Watchdog" a system watchdog is triggered. |
diagSetName |
Here you define which DiagnosticSet should be used for the CPULoadEventSubcsiption. A DiagnosticSet defines which log files are to be collected for the subscription. It is specified in the element <DiagnosticSets>.If you do not want to collect log files, enter diagSetName="disabled". Only warning notifications will be displayed then. See also section Diagnostic_folder. |
<SystemRamLoadEventSubscriptions>
The element SystemRamLoadEventSubscriptions defines the monitoring of RAM utilization and the corresponding reactions to certain events.
SystemRamLoadEventSub
| Attribute | Description |
name |
Unique name of the SystemRamLoadEventSubscriptionsIf a new name is created, a new subscription is created with it. |
upperThresh |
This attribute sets the upper threshold for the RAM load (for example upperThresh="95" at 95 %). If the RAM load exceeds this value, the specified reaction (for example a warning) will be triggered after the duration specified in upperDur. |
lowerThresh |
This attribute sets the lower threshold for the RAM load (for example lowerThresh="70" at 70 %). If the RAM load falls below this value, a notification is issued after the duration specified in lowerDur (only for reaction="Warning"). |
upperDur |
The RAM load must exceed the upper threshold (upperThresh) for the time defined in upperDur (for example upperDur="10s" for 10 seconds) before the reaction is triggered. |
lowerDur |
The RAM load must remain below the lower threshold (lowerThresh) for the time defined in lowerDur(for example lowerDur="60s" for 60 seconds). |
reaction |
This attribute specifies the action to be taken when the thresholds are crossed. With reaction="Warning", a warning is issued. With reaction="Watchdog" a system watchdog is triggered. |
diagSetName |
Here you define which DiagnosticSet should be used for the CPULoadEventSubcsiption. A DiagnosticSet defines which log files are to be collected for the subscription. It is specified in the element <DiagnosticSets>.If you do not want to collect log files, enter diagSetName="disabled". Only warning notifications will be displayed then. See also section Diagnostic_folder. |
<SystemMemLoadEventSubscriptions>
Available with firmware version 2026.0 LTS and newer
The element SystemMemLoadEventSubscriptions defines monitoring of the overlay file system utilization. Each subscription is defined by the XML element:
| Attribute | Description |
name |
Unique name of the SystemMemLoadEventSubscirption.If a new name is created, a new subscription is created with it. |
mem |
Type of memory to monitor. Use OFs for the Overlay File System. |
upperThresh |
This attribute sets the upper threshold for the Overlay File System’s memory load in percent (for example upperThresh="97" at 97 %). If the memory load exceeds this value, the specified reaction (for example a system watchdog) will be triggered after the duration specified in upperDur. |
lowerThresh |
This attribute sets the lower threshold for the Overlay File System utilization (for example lowerThresh="70" at 70 %). If the utilization falls below this value, a notification is issued after the duration specified in lowerDur (only for reaction="Warning"). |
upperDur |
The OFS load must exceed the upper threshold (upperThresh) for the time defined in upperDur (for example upperDur="10s" for 10 seconds) before the reaction is triggered. |
lowerDur |
The OFS load must remain below the lower threshold (lowerThresh) for the time defined in lowerDur(for example lowerDur="60s" for 60 seconds). |
reaction |
This attribute specifies the action to be taken when the thresholds are crossed. With reaction="Warning", a warning is issued. With reaction="Watchdog" a system watchdog is triggered. |
diagSetName |
Here you define which DiagnosticSet should be used for the CPULoadEventSubcsiption. A DiagnosticSet defines which log files are to be collected for the subscription. It is specified in the element <DiagnosticSets>. If you do not want to collect log files, enter diagSetName="disabled". Only warning notifications will be displayed then. See also section Diagnostic_folder. |
<DiagnosticSets>
The DiagnosticSets element defines various diagnostic sets that can be activated for certain events.
| Attribute | Description |
DiagnosticSet name |
Unique name of the DiagnosticSet |
collectLogs |
true: Log files should be collectedfalse: No log files are collected
|
ramLoads |
true: RAM load is monitoredfalse: RAM load is not monitored
|
cpuLoads |
true: CPU load is monitored false: CPU load is not monitored
|
lttng |
true: lttng tracing is activatedfalse: lttng tracing is deactivated
|
<StartUpCheckConfig>
Available with firmware version 2026.0 LTS and newer
The StartUpCheckConfig elements define checks to be performed during the firmware’s startup phase. Using the XML element OverlayFsCheckConfig a reserve file can be configured here. If there is enough free memory during start up the firmware creates a file of the configured size. A notification informs about the available size and whether a reserve file has been created.
If the firmware starts after a System Watchdog (SWD) that occured due to low Overlay File System memory, the firmware will remove this file to ease investigation of this system watchdog and the cause for the low memory situation. Additionally, a notification is emitted.
| Attribute | Description |
reserveFileSizeInPercent |
Size of the reserve file /opt/plcnext/data/System/Monitoring/ofsreserve.bin in percent of the Overlay File System capacity. Phoenix Contact recommends to use at least 12 %. Note: By the feature reserved blocks Linux also reserves 5 % for the root user at ext4 file systems. This Linux reserve is not shown by the command df.
|
diagSet |
Use the same diagSetName as with the Overlay File System load subscription. |
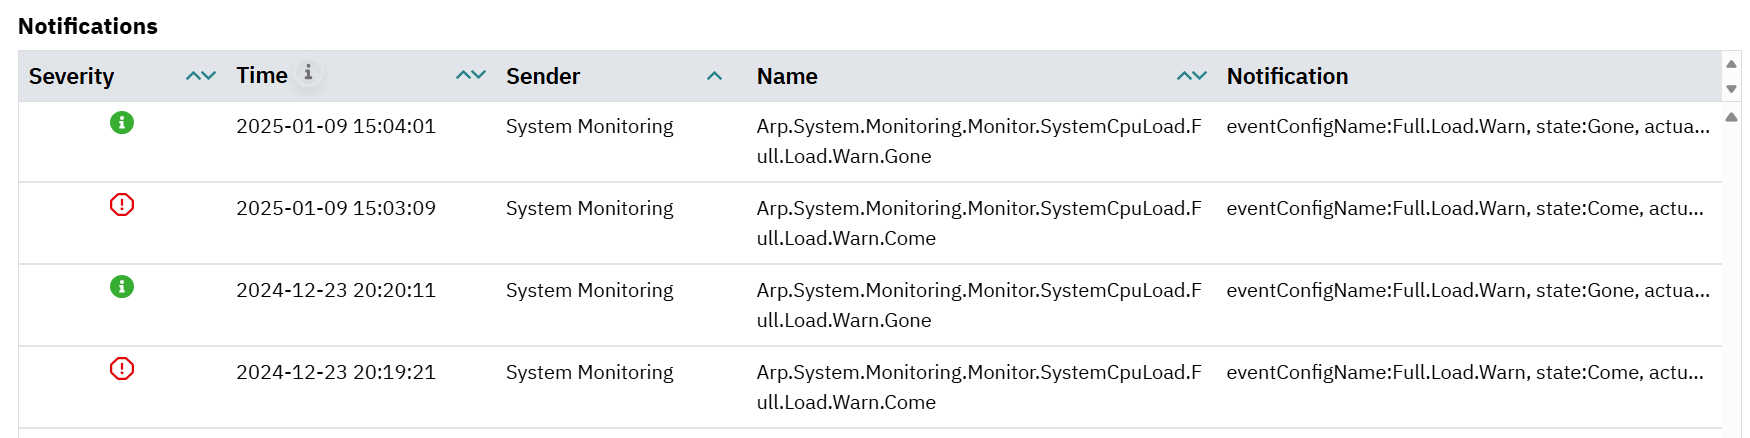
Notifications
The warnings issued by the System Monitoring component are displayed as notifications, for example in the WBM of the device (Diagnostics - Notifications). System Monitoring is displayed as the sender of the notification. See also Notifications of PLCnext Runtime.
Diagnostic folders
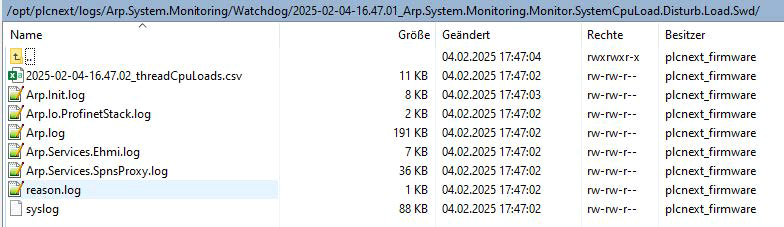
For each warning or emergency exit, a diagnostic folder is created in /opt/plcnext/logs/Monitoring/Watchdog. The folder name is composed of the timestamp and the event name. There can be a maximum of 10 directories. The most current ones are retained.
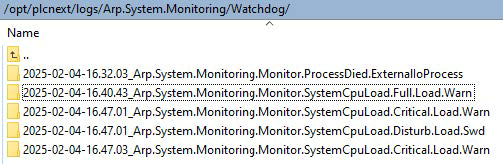
Each folder contains log sets relevant to the event that occurred.