Remote debugging of C++ code
Suitable with AXC F x152 up to firmware 2024.6 and with inactive Security Profile only
PLCnext Technology has an integrated GDB server, so you can set up a remote debugging session. Read more about the GDB server if you're new to this tool or interested in the complete functionality of this tool.
Setting up the station for a remote debugging session takes some time, but remote debugging your C++ code on your PLCnext Control will be a very useful feature that's worth the effort. Most effort goes into the debug configuration, and once you finished that for your station, the rest is quite as simple as you perhaps already know it as an experienced developer.
Note: For the time being, a remote debugging procedure cannot be performed on a safety-related controller due to untouchable safety tasks.
Step-by-step instructions
Using the Visual Studio® IDE
See the regarding Maker's Blog article in the PLCnext Community.
Using the Eclipse® IDE
Tutorial videos
![]()
Note: Tutorial videos are embedded from the Phoenix Contact Technical Support YouTube channel. With playing an embedded YouTube video in this platform, you accept the YouTube Terms & Conditions. Even showing the video previews on this page depends on your personal settings. To watch YouTube videos, you have to allow cookies for marketing purposes which will remain on your device. The data gained through these cookies will be used by YouTube to provide video suggestions and advertisements based on your browsing habits, and that data may be made available to other parties.
How to set up a remote debugging session for C++ programming with Eclipse® version 2019-03 (Neon)
| 11m:42s | HDTV 720p | English | English |
Note: The above tutorial video and the following step-by-step instructions differ in these regards:
- In the video, the Eclipse IDE version is 2019-03. The screenshots in the instructions below are of an older Eclipse® version, but the options are still the same.
- In the video, Frank chose a slightly different route to start debugging after setting up the Debug configuration; both ways are similarly successful.
Prerequisites
Used in this description:
- Firmware 2019.x of the AXC F 2152.
- Phoenix Contact Eclipse® Add-in 2020.0 LTS
- Eclipse® 2019-9
Newer versions might differ visually but the procedure is still the same.
Note:
- The task watchdogs must be deactivated (
0 ms) during the debug session. - The shared library must be created in Debug build mode.
- The shared library (.so file) on the host system (Eclipse workspace) and on the PLCnext Control target must be the same.
- The overall performance between steps can take a few seconds.
- For some steps you'll need
rootoradminuser privileges (asadminuser, use thesudoprecommand).
Debug Configuration
- Open your C++ program in the Eclipse IDE.
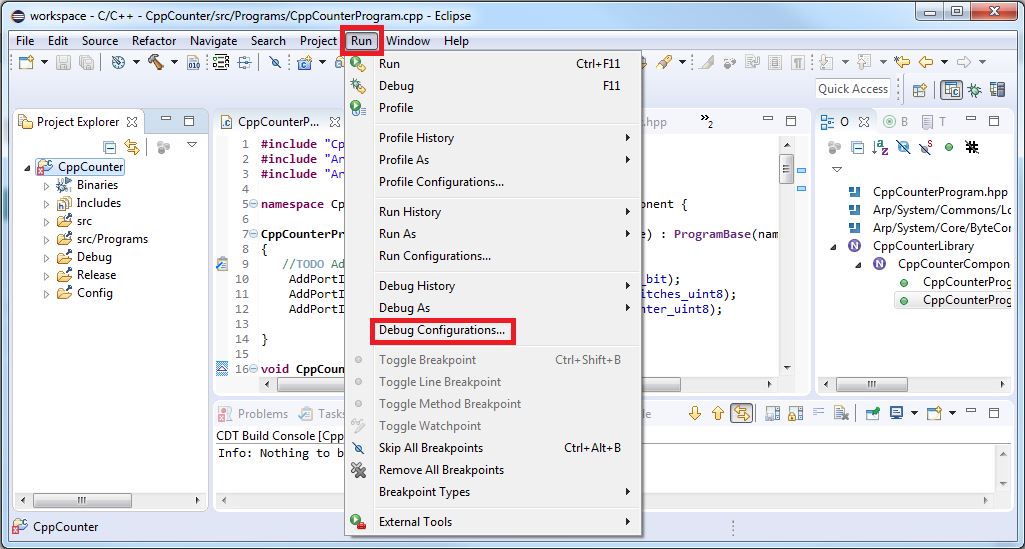
Note: Make sure to meet the prerequisites regarding the Eclipse versions that these instruction are based on. - Start the debug configuration by the Run → Debug Configurations... menu:
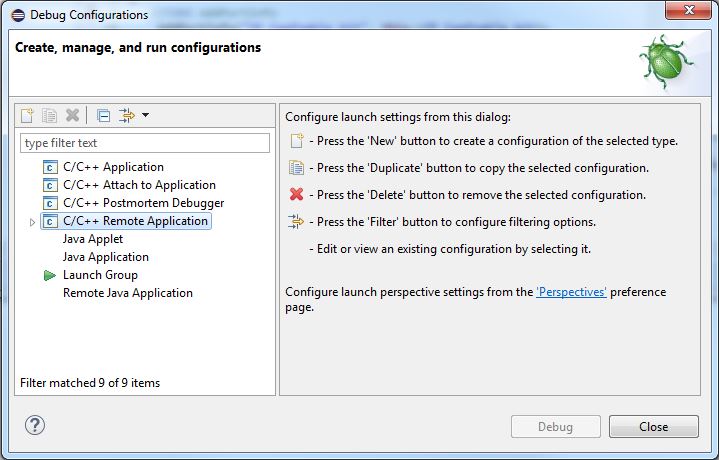
- Create a C/C++ Remote Application by double-clicking the list item:
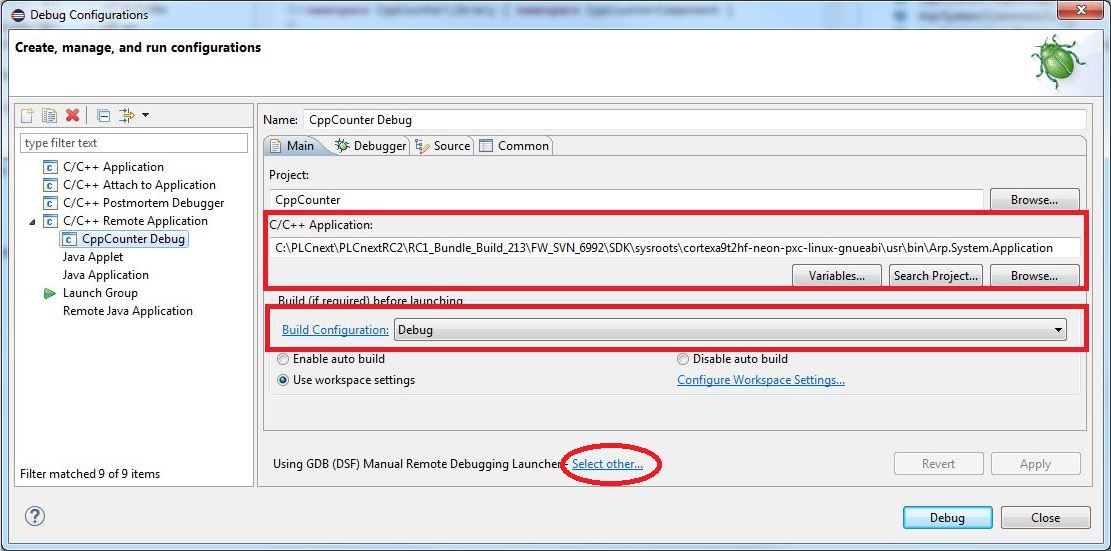
- On the Main tab that shows up in the right section of the dialog box,
- insert the path to the C/C++ application executable, e.g.:
FW_SVN_XXXX\SDK\sysroots\cortexa9t2hf-neon-pxc-linux-gnueabi\usr\bin\Arp.System.Application - Set the "Build Configuration" drop-down menu
to Debug (in Eclipse Neon):
to Use Active (in Eclipse Photon):
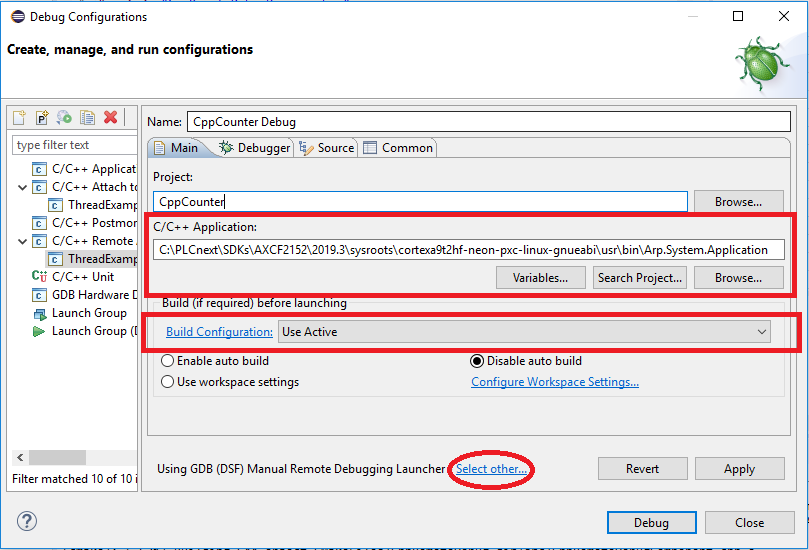
- Click the Select other link (same in both Eclipse Neon and Photon).
- insert the path to the C/C++ application executable, e.g.:
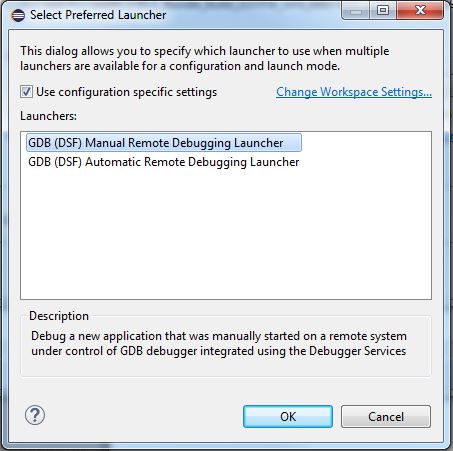
- In the Select Preferred Launcher dialog box,
choose GDB (DSF) Manual Remote Debugging Launcher and close with the OK button:
- Back in the Debug Configuration dialog, switch to the Debugger tab, Main subtab,
- and make sure to have enabled the checkboxes shown here:
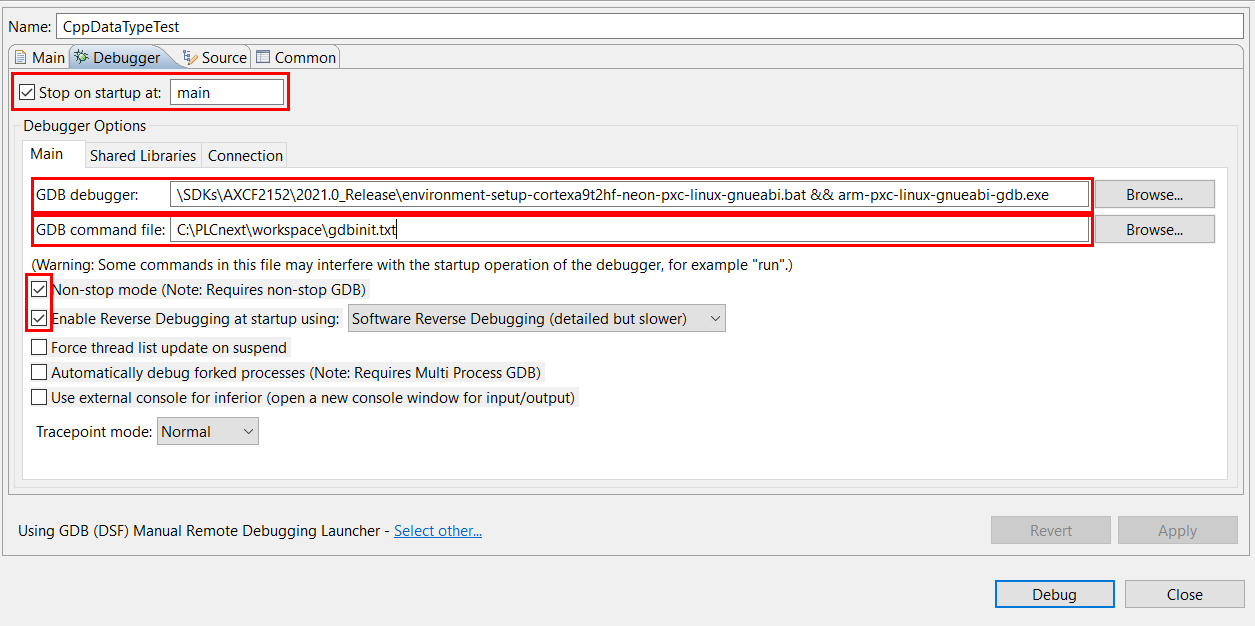
- As the GDB debugger, insert the command to execute a specific .bat file and just the file name of the gdb executable, e.g.:
cmd /c C:\PLCnext\SDKs\AXCF2152\2021.0_Release\environment-setup-cortexa9t2hf-neon-pxc-linux-gnueabi.bat && arm-pxc-linux-gnueabi-gdb.exe - As the GDB command file, create a gdbinit.txt file containing the following handles and add it:
handle SIGUSR2 nostop noprint
handle SIGILL nostop noprint
handle SIGSTOP nostop noprint
- and make sure to have enabled the checkboxes shown here:
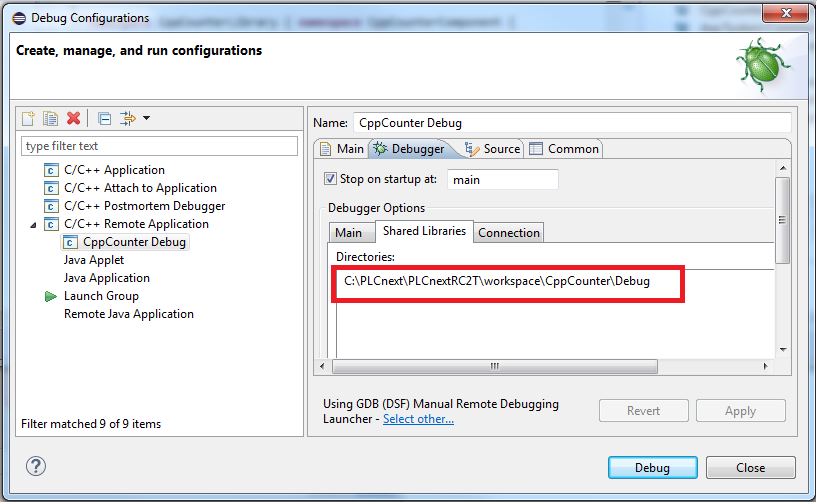
- On the Shared Libraries subtab of the Debugger tab,
- insert the directory of the shared library to debug; usually, the library of an Eclipse® project is saved in the Debug or Debug\lib subdirectory to a program.
- insert the directory of the shared library to debug; usually, the library of an Eclipse® project is saved in the Debug or Debug\lib subdirectory to a program.
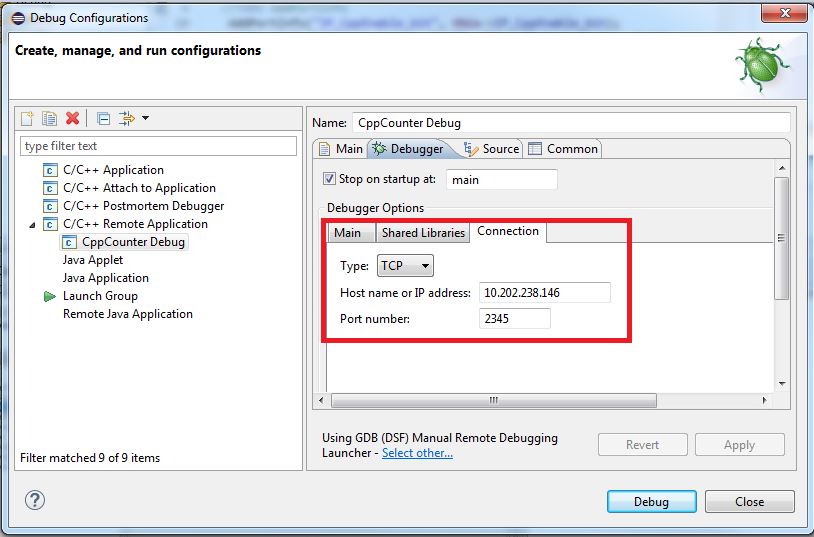
- On the Connection subtab of the Debugger tab,
- insert a host name or IP address of the remote target
- insert the port on which the GDB server instance is listening
- Click the Close button and proceed to the next section.
Attaching to the remote GDB server

Risk of personal injury or damage to equipment
Using the debugging function can result in an unsafe process interruption.
Ensure that there is no risk of personal injury or damage to the equipment.
Note:
- When executing the
gdbserver --attachcommand, the whole PLCnext task will go intoStopmode, so the OUT ports will stand still and the remote connection to PLCnext Engineer will be interrupted. - After debugging, the PLCnext task will remain
stopped(i.e. detached or disconnected in Eclipse®) and has to be restarted manually: Issue the restart command from the shell (see firmware commands), or restart the controller by pressing theResetbutton on its housing, or switch the current off and on again. - A breakpoint in GDB will stop the cyclic task only, so all other programs will keep running.
- A breakpoint in PLCnext Engineer prohibits the call of C++ programs, so all tasks controlled by the ESM will stop.
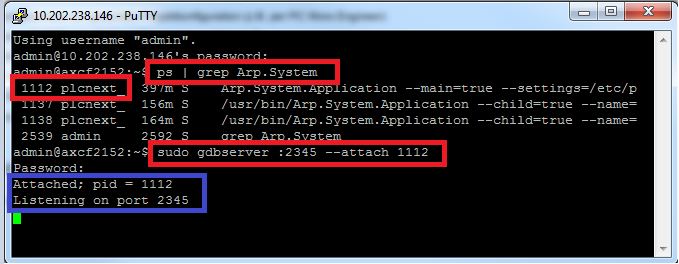
- Log into a shell session on the remote system.
- Determine the process ID of PLCnext Technology process:
- With firmware 2019.0 LTS to 2019.9, issue this command:
ps | grep Arp.System - From 2020.0 LTS, issue this command:
ps aux | grep Arp.System
- With firmware 2019.0 LTS to 2019.9, issue this command:
- Start the gdbserver and attach it to the desired port:
sudo gdbserver :2345 --attach <your process ID here>
resulting in this answer if successfully attached:
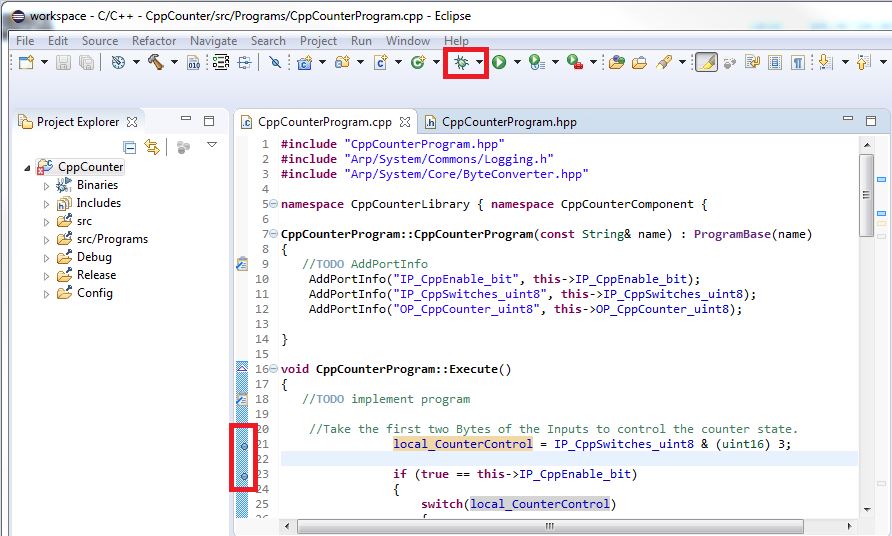
Setting the breakpoints and starting a debug session
- Select the newly created debug configuration by means of the "Debug" menu icon:
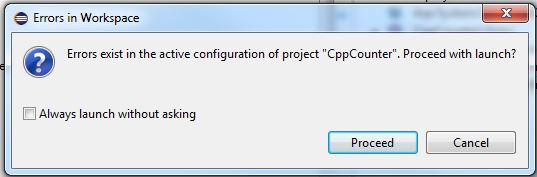
- It might happen that warnings or errors are displayed after starting the debug session.
- Warnings in Eclipse® Neon:
Prevent that by checking Always launch without asking in the dialog box:
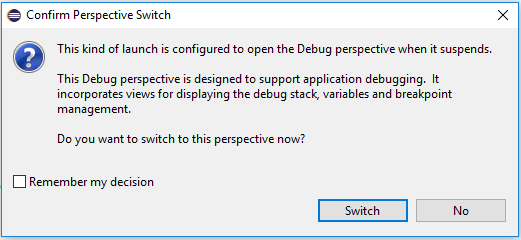
- Warning in Eclipse® Photon:
Prevent that by checking Remember my decision in the dialog box:
- Warnings in Eclipse® Neon:
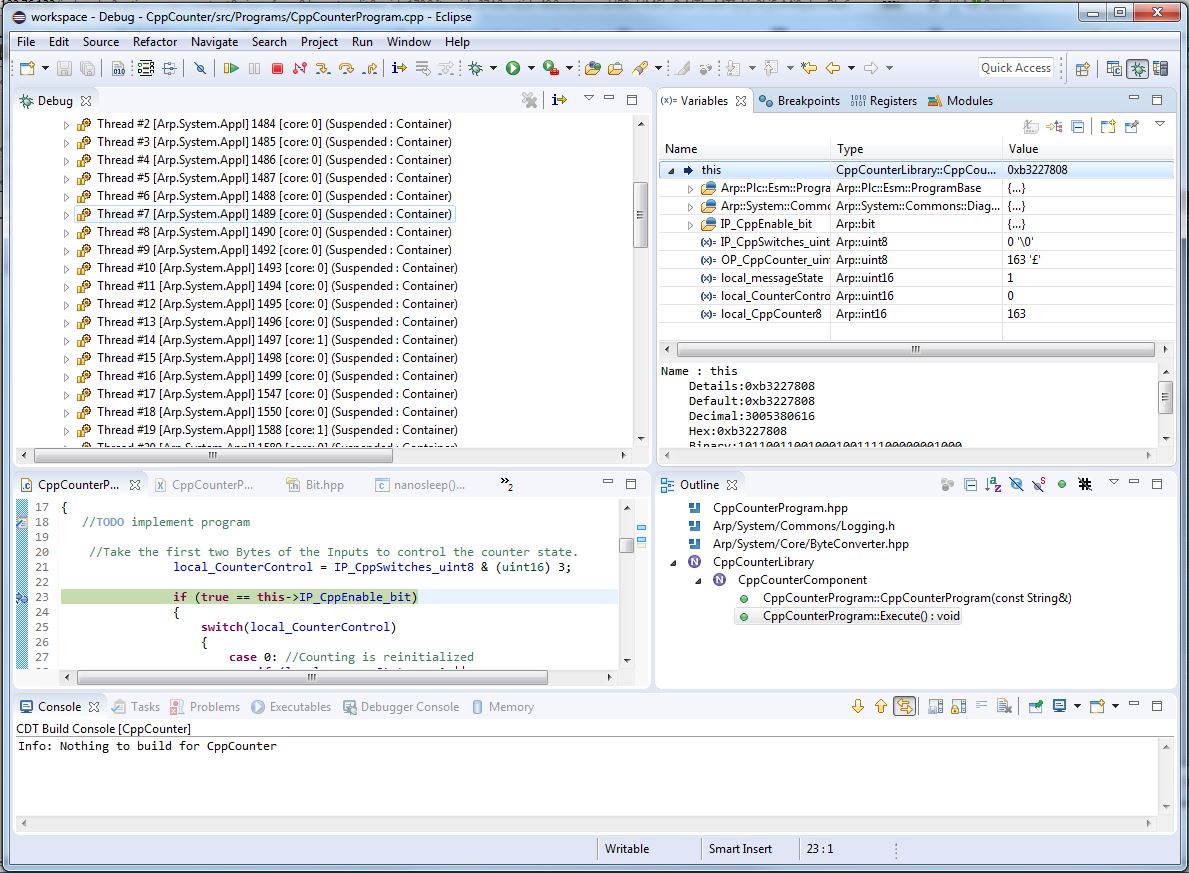
- The Eclipse debug view appears where you can add breakpoints and step through your code:
- For actions in this environment, please refer to the Eclipse Neon Online Help or the Eclipse Photon Online Help.