By using embedded systems (and a PLC is in fact nothing else) it is a vital requirement to analyze the timing behavior of the application (programs and tasks). This is not only useful to enhance the general performance of an application, but absolutely necessary to find seldom and sporadic issues.
We decided to use for that purpose the powerful Linux open source package LTTng (Linux Trace Toolkit Next Generation – http://lttng.org) and to give the application engineers the full insight into the system.
This manual should introduce the general usage of LTTng for the AXC F 2152 with the stand alone tool Trace Compass (http://tracecompass.org)
The first implementation offers the possibility to start and stop traces which are stored in a ringbuffer inside the AXC 2152 (approx. 10s are stored).
Within the next implementation steps it is planned to trigger the trace via system events, enhance the maximum stored timeframe and to offer a “live” streaming. By using the “live” streaming it will be possible to record directly via a remote connection with Trace compass.
Used Software
- PLCnext Technology Build 1.0.0.250 or later
- Trace Compass 3.1.0 (can be downloaded from http://tracecompass.org/)
Start and stop a trace
1. (Skip this step if using firmware version 2019.0 or later)
Open the console and connect your computer with the controller:
ssh <username>@<IP address>
2. (Skip this step if using firmware version 2019.0 or later)
After login start the trace mode:
sudo /etc/init.d/plcnext tracmode
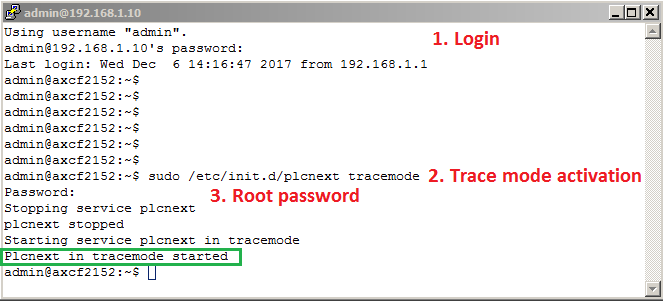
Activate Tracemode
3. Open Trace Compass and create a new SSH connection:
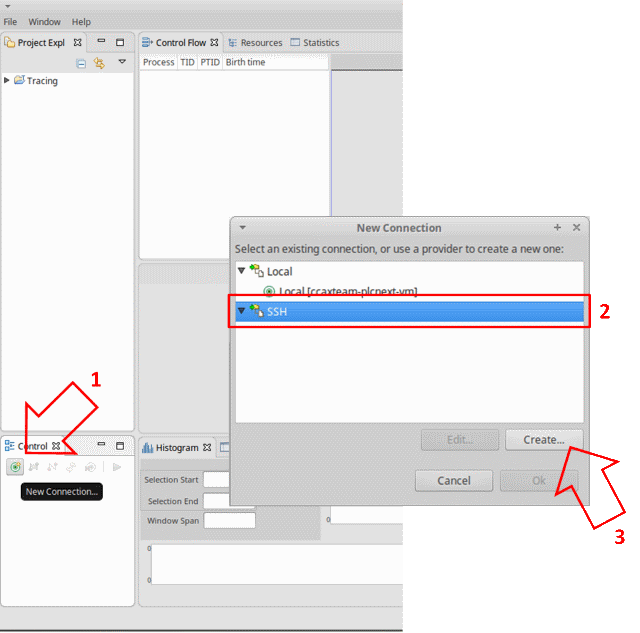
Open a SSH connection
4. Edit the following properties:
- Connection name
- Host IP address
- User Name
- Passwort
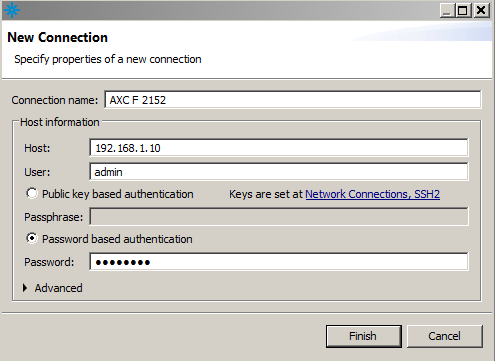
SSH configuration
5. Connect the controller via right click and “Connect”. It might fail at the first time, in that case just try it again.
If the connection establishment was successful a tree structure inside of the “Control” window becomes visible.
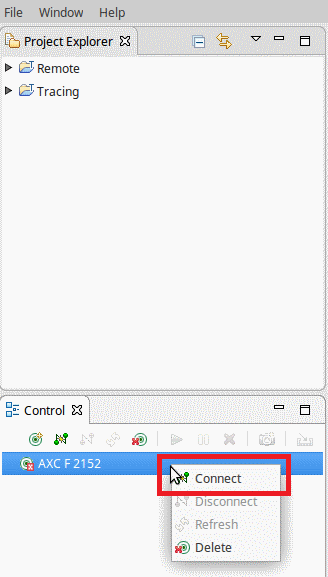
Establish connection
6. To load a session you have to select the entry “Session” inside of the tree. After right click and “Load” a “Browse File” window pops up.
There you need to configure the shown settings. The button “Up one level” in step 3 helps to jump to “/opt/plcnext/lttng”.
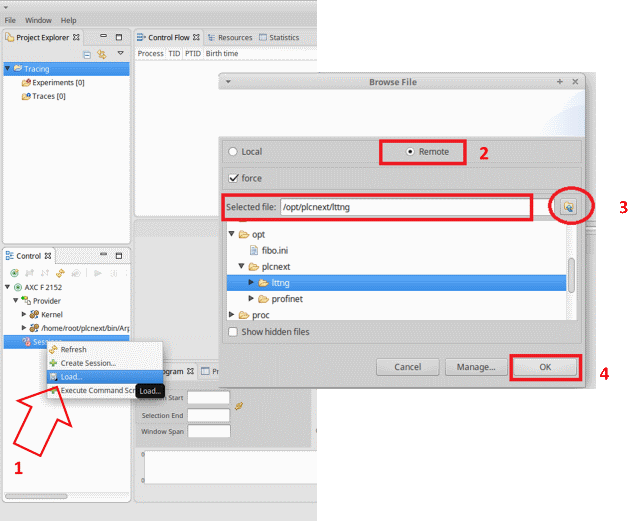
Load Session
7. Now you can start and stop the trace session.
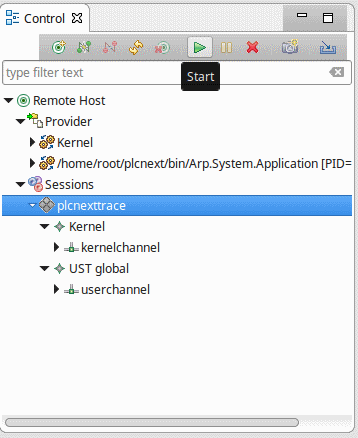 | 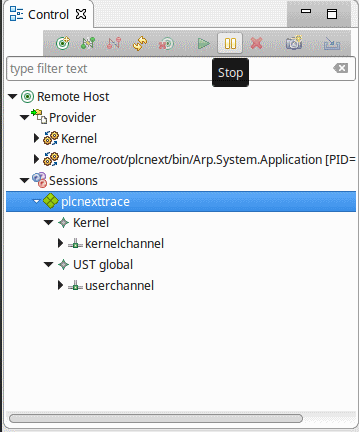 |
| Start and stop recording |
8. The import of the remote traces to the “Project Explorer” is available by choosing the “plcnexttrace” level and click on the right button in the “Control” window menu. Then a window pops up that has to be configured as show in the picture below.
Hint: Make sure that the “ust” folder and “kernel” are enabled.
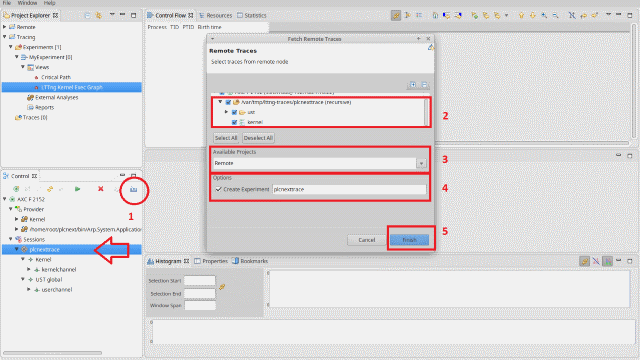
Import a trace
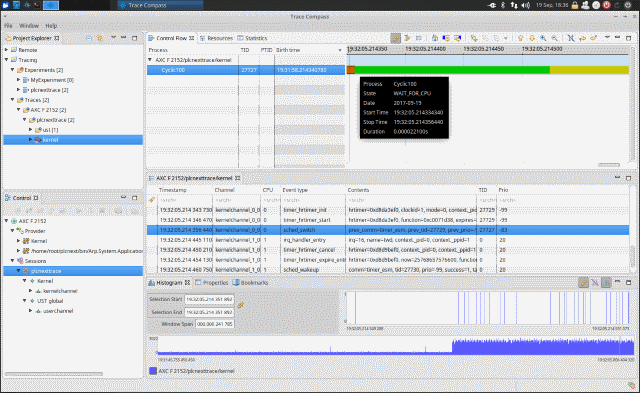
9. Finally open, for instance, the kernel view inside of the “Project Explorer”. On the right side you can find different views for your trace.

Kernel view
Analyse a trace with Trace Compass
The following tips and tricks should give you a short introduction into the handling of the open source tool Trace Compass,
please check for more details the Trace Compass documentation or community (http://tracecompass.org).
How to filter tasks in the Control Flow view
The raw capture includes all tasks and system processes of the PLCnext Technology application, operation system and your application.
To get a better overview it is mostly necessary to filter the trace, maybe only for your application tasks.
- Select the filter button
- Disable all checkboxes for tasks that are not of interest for your analysis
- Press “OK”
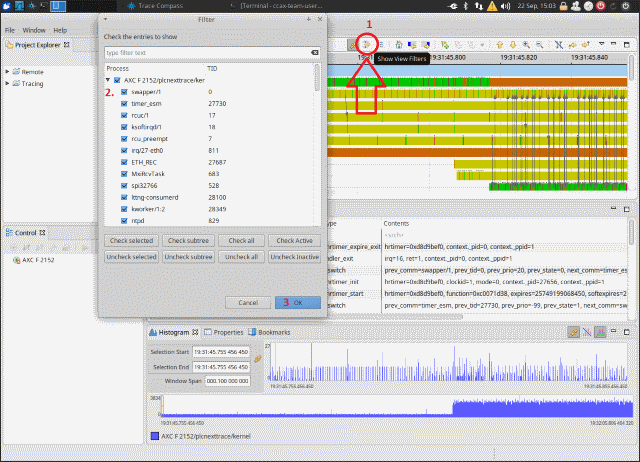
Trace Filter
In the following screenshot is the filter applied to show only the application tasks “Cyclic100”.
Every PLCnext Technology application tasks uses the following marks:
- Task executing
- Program executing
- Program executed
- Task executed
With those marks it is easily possible to follow the timing behaviour of the application.
Filter a ESM user Task
Analysis of tasks
To find a task call use the zoom functions and scroll bar.
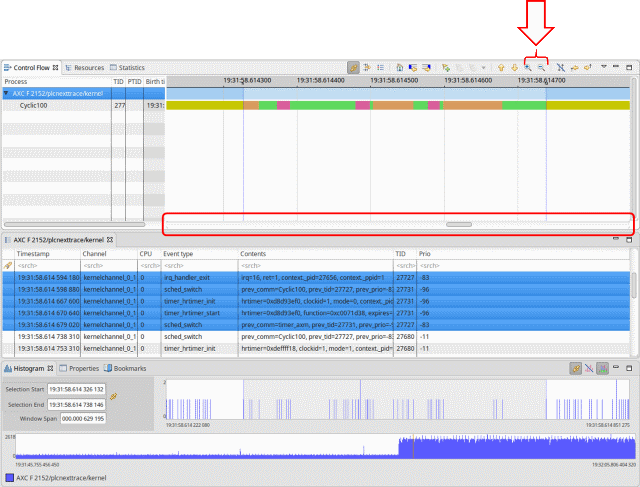
Zoom function
The meaning of the different colors is shown in a legend.
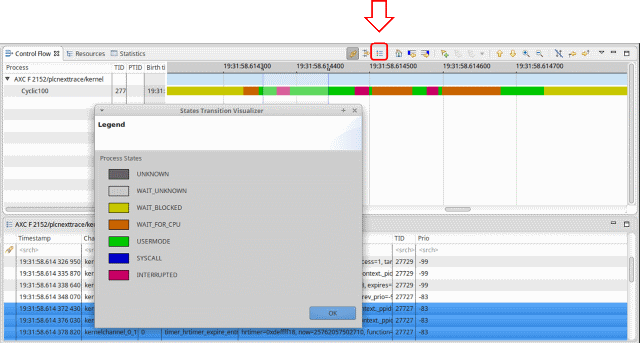
Legend of task states
The Control Flow window offers further information to process states by moving the cursor over the task.
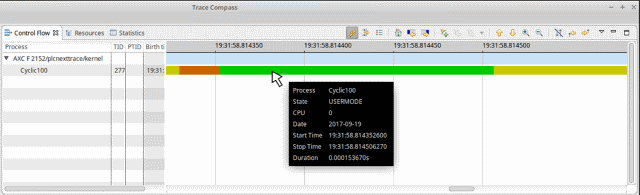
Control flow view
To analyze the task duration you can set time markers within the control flow.
Click inside of the “Control Flow“ Window and mark the respective zone. The time span can be calculated with the shown values inside of the “Histogram“.
Time markers
Tips and Tricks
By using Trace Compass it might be useful to keep the following tips & tricks in mind.
How to edit connection setting afterwards
Especially using many PLCnext Technology devices it will become useful to handle several connections.
- Open Window → Preferences
- Select Remote Connections on the left
- To have the possibility to change configuration you have to close the respective connection. Therefor use the “Close” button. Then click on “Edit” button.
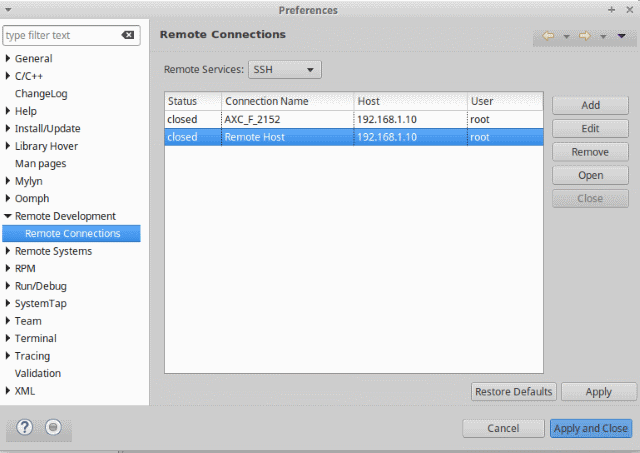
Manage multiple connections
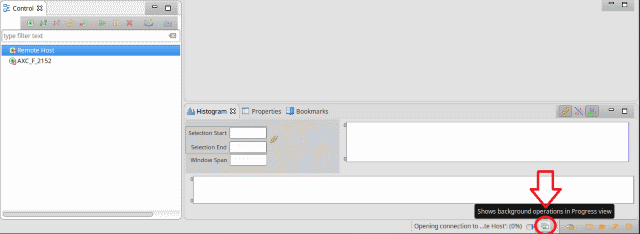
How to stop a long-lasting connection establishment
It might happen that a remote connection is not terminated and still working in the background. This will prevent another connection.
With the next two steps you can terminate existing connections.
- Open the window for background operations.

Background operations - Terminate existing connections
Terminate a background operation
Leave a Reply
You must be logged in to post a comment.